







spacebands is a multi-sensor wearable that monitors external, environmental hazards, anticipates potential accidents, and gives real-time data on stress in hazardous environments.
Members of:






Recognition:






The Health and Safety Executive (HSE) has published its 2026 health and safety statistics for Great Britain (November 2026). In 2025/26, an estimated 1.8 million workers experienced work-related ill health, down from 1.9 million the year before. Stress, depression or anxiety accounted for nearly half of those cases. Worker deaths fell from 128 to 126, while the estimated number of workers who sustained a non-fatal injury rose from 680,000 to 688,000.
We’ve turned the official HSE figures into a visual guide for safety managers, HR teams and business leaders. Use it to brief your team or share the figures in your next board meeting. Download the 2026 Health & Safety Infographic.
Below, we compare the latest figures with the previous year, look at which injuries and illnesses cost the most working days, and explore what the findings mean for organisations planning their health and safety priorities for 2027.
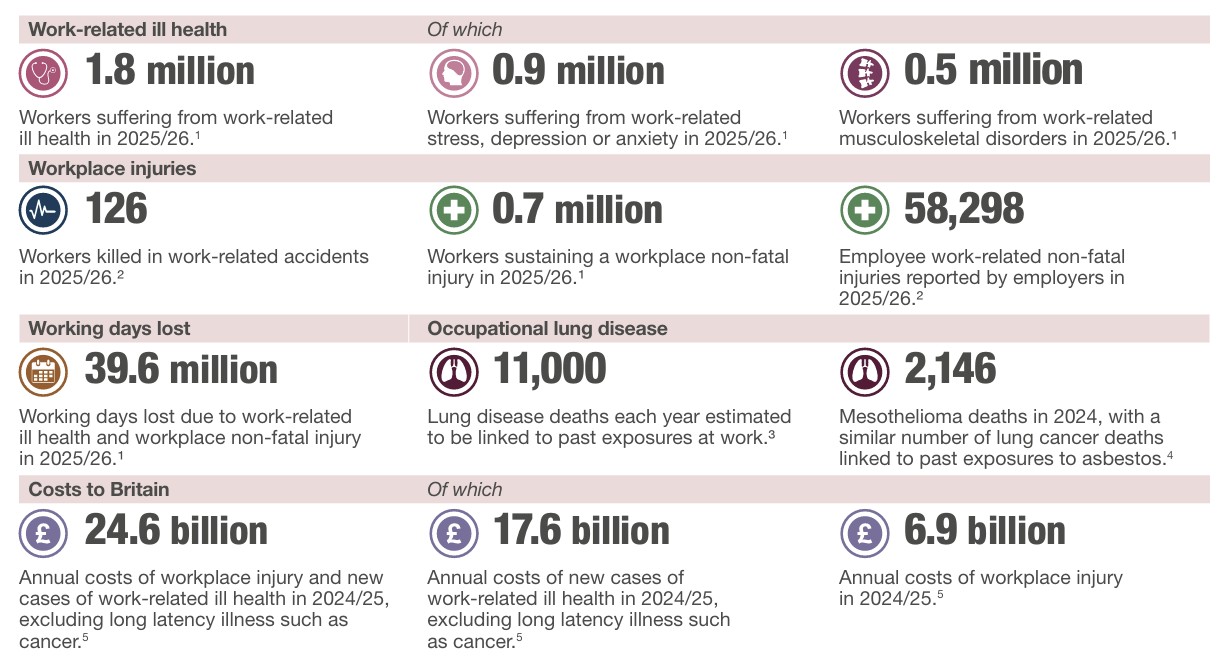
The fatality comparison uses HSE’s finalised figures for 2024/25 and provisional figures for 2025/26. Ill health, non-fatal injuries to workers and working days lost are Labour Force Survey estimates. Small annual changes can reflect variation in who was surveyed. HSE’s 2026 key figures · HSE’s 2025 release
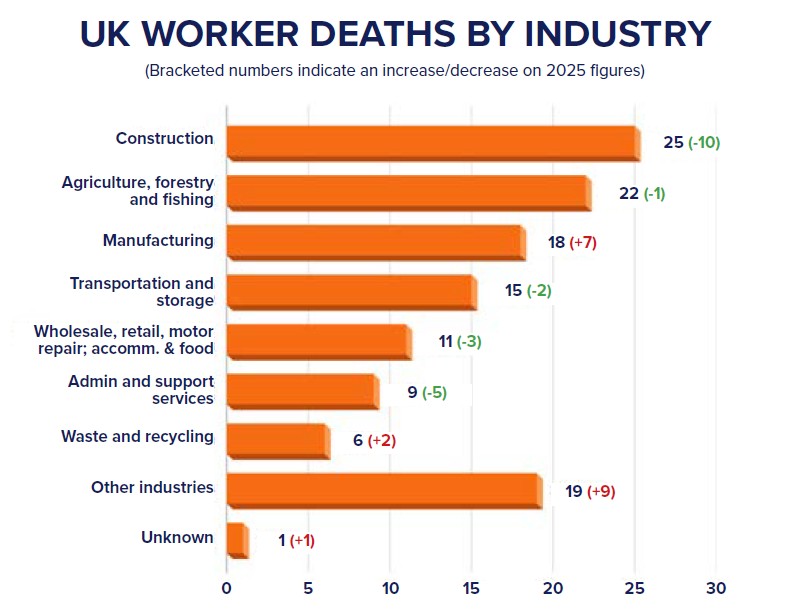
HSE recorded 126 worker deaths in 2025/26, two fewer than the revised total of 128 the previous year. Construction recorded 25 deaths, down from 35. Agriculture, forestry and fishing recorded 22, down from 23. Together, those sectors accounted for 47 deaths, or 37% of all workers killed.
Manufacturing recorded 18 worker deaths and transportation and storage recorded 15. The highest fatal injury rate was in agriculture, forestry and fishing: 8.09 deaths per 100,000 workers, compared with 0.37 across all industries. That helps explain why a sector with fewer deaths than construction can still present a greater risk to each worker.
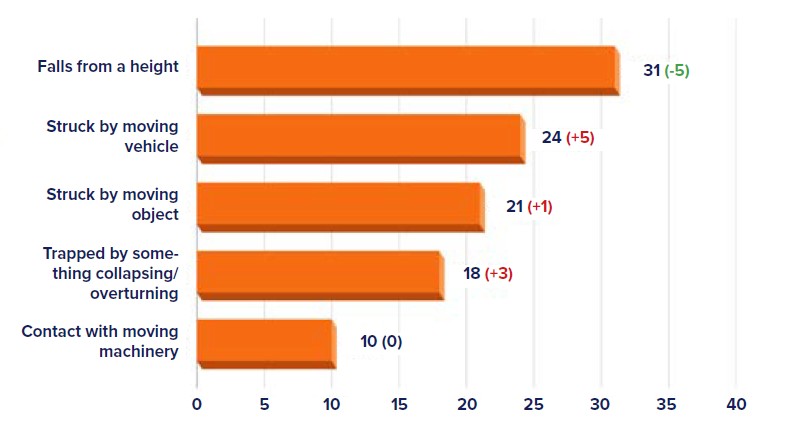
Falls from height remained the leading cause, accounting for 31 deaths, roughly one in four. Moving vehicles accounted for 24 and moving objects for 21. Separately, 104 members of the public died in work-related accidents, up from 96 the previous year. HSE’s fatal injury figures
The Labour Force Survey puts the number of workers injured at 688,000, up 8,000 from 680,000 in 2024/25. Of those injured in 2025/26, an estimated 145,000 were off work for more than seven days. HSE describes the self-reported injury rate as broadly flat over the past four years.
Employers reported 58,298 non-fatal employee injuries under RIDDOR, compared with 59,219 in last year’s release. These sources cover different groups. The survey asks workers about injuries they experienced, while the employer figure covers employee injuries that meet RIDDOR reporting criteria.
Slips, trips and falls on the same level accounted for 29% of employer reports, down from 30%. Handling, lifting or carrying rose from 17% to 18%. Together those two categories accounted for almost half of reported injuries. Acts of violence and being struck by a moving object each accounted for 11%, up from 10%, while falls from height accounted for 8% in both releases. HSE’s non-fatal injury statistics

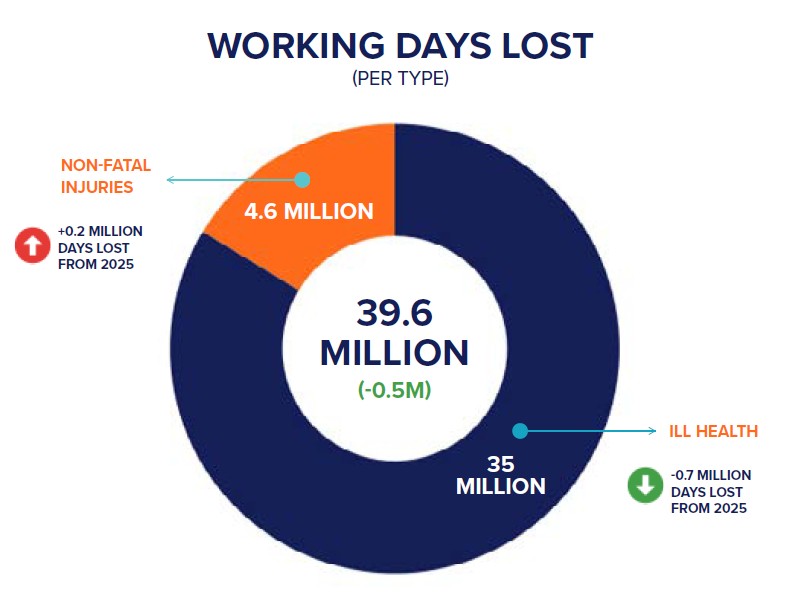
Work-related ill health accounted for 35 million days lost, down from 35.7 million. Non-fatal injuries accounted for 4.6 million, up from 4.4 million. That puts ill health at 88% of the total.
The musculoskeletal figures tell a story that a case count alone would miss. 34,000 fewer workers reported a work-related musculoskeletal disorder, yet the estimated time lost rose from 7.1 million to 7.5 million days. Back problems accounted for 38% of cases, and upper limb or neck problems for another 37%. For a supervisor reviewing repeated absences, it’s worth asking which lift, carry or reach becomes hardest towards the end of a shift.
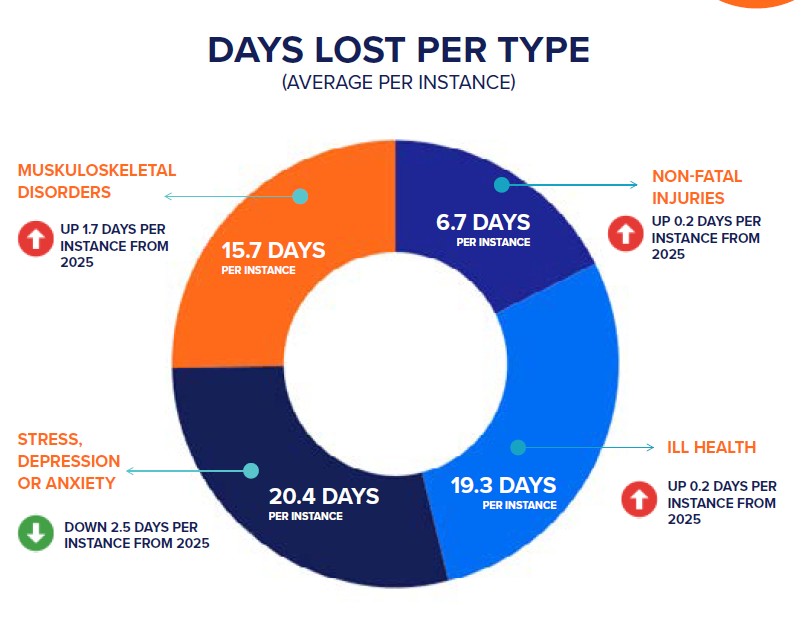
An estimated 891,000 workers experienced stress, depression or anxiety caused or made worse by work in 2025/26, down from 964,000. These conditions accounted for 49% of work-related ill health and 18.2 million working days lost, compared with 22.1 million the previous year.
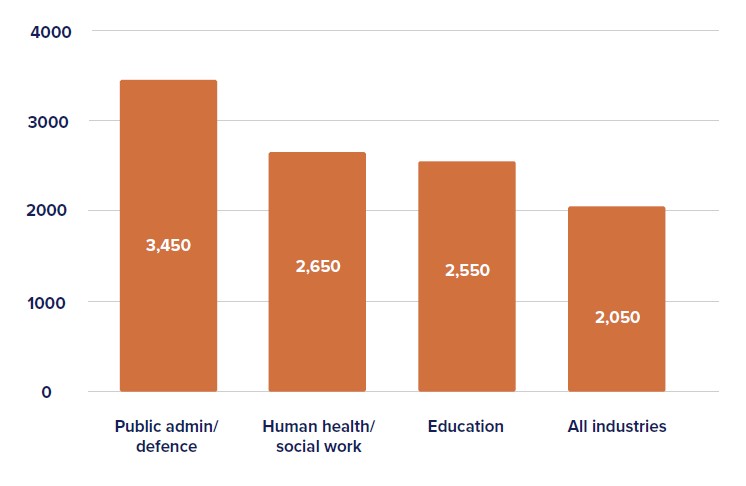
Across the three years from 2023/24 to 2025/26, rates were above the all-industry average in public administration and defence, human health and social work, and education. Although this year’s national estimates fell, HSE finds no consistent trend in the stress rate over the past four years. It remains above pre-pandemic levels.
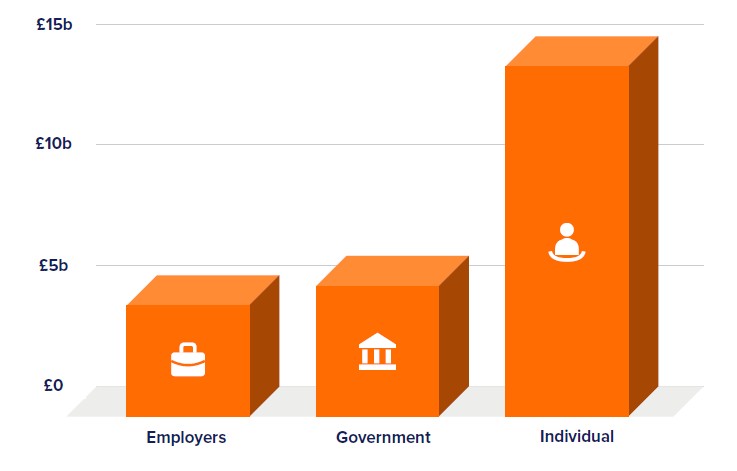
HSE estimates that workplace injuries and new cases of work-related ill health cost Great Britain £24.6 billion in 2024/25. The cost estimate runs a year behind the main release. Last year’s publication quoted £22.9 billion for 2023/24. The £1.7 billion difference between the published estimates includes changes in prices. At 2025 prices, HSE estimates that the cost rose by £600 million between 2023/24 and 2024/25.
Individuals bore the largest share, £14.5 billion, followed by government at £5.4 billion and employers at £4.6 billion. The estimate includes lost output and healthcare costs, alongside the value HSE assigns to pain, suffering and loss of life. The components are rounded. HSE’s cost breakdown and real-terms comparison
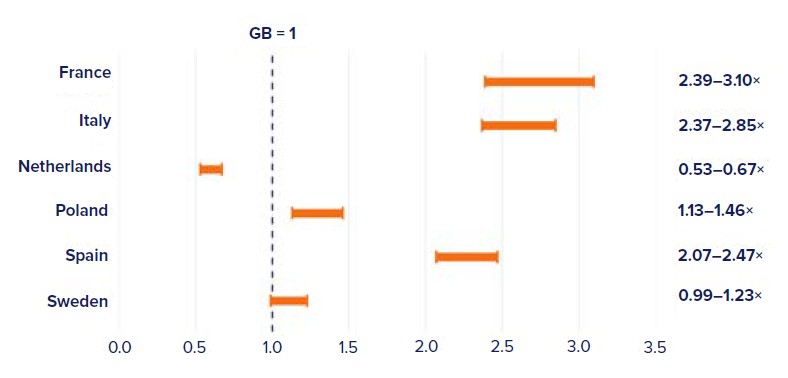
HSE’s international analysis compares fatal injury rates over 2014–2023, allowing for differences in workforce size and industry mix. France’s estimated rate was 2.39 to 3.10 times Great Britain’s. The Netherlands’ was 0.53 to 0.67 times Britain’s. For Sweden, the interval included 1, so the analysis could not establish a clear difference from Great Britain.
Each country is compared directly with Great Britain. Differences in how countries record fatalities still matter when reading the results. HSE’s international comparison report
Start with the two figures most likely to sit in different reports: how many people were hurt and how much time people lost to ill health. If the board only sees the accident count, it can miss a rise in absence linked to the way work is organised or the physical demands of a particular task.
Choose one recurring issue and take it back to the team doing the job. On a fabrication shift, that could mean asking why a grinder is in use for longer than the risk assessment assumes. Where teams use spacebands, workers can receive vibration or noise alerts during the shift. Once the wearables upload on charge, a supervisor can review the exposure record with the worker, agree a change and check how the next comparable shift went.
Download the 2026 health and safety infographic
HSE estimates 39.6 million days in 2025/26. Ill health accounted for 35 million and non-fatal injuries for 4.6 million.
Stress, depression or anxiety was the largest category. It affected an estimated 891,000 workers and accounted for 49% of work-related ill health.
Slips, trips and falls on the same level accounted for 29% of non-fatal employee injuries reported by employers under RIDDOR in 2025/26.
Agriculture, forestry and fishing recorded 8.09 fatal injuries per 100,000 workers in 2025/26. Construction had the largest number of deaths, at 25.
The annual release covers Great Britain, meaning England, Scotland and Wales. Northern Ireland falls outside this dataset.
